Physical Address
304 North Cardinal St.
Dorchester Center, MA 02124
Physical Address
304 North Cardinal St.
Dorchester Center, MA 02124

Project Communication is clearer if consistent symbology is used for your project presentations. You will spend less time explaining the meaning of the symbols on your schedule and will have more time available to clarify your project’s progress.
While there is a wide variety of project management symbology to choose from, and it’s unlikely that all companies and government agencies will ever agree to a standard set of symbology, project managers should make an attempt to come up with a standard set of symbology to use throughout their organization for the duration of their project. In a big company, it is a good idea to agree on standard company-wide project symbology so that executives who attend many project status presentations do not have to be briefed on the significance of the symbology before each presentation. If a circled red arrow means “critical milestone” for project A, it should not mean “completed” for project B.
Milestones Professional is excellent project presentation software which can be used to clearly communicate your project.
This paper shows several examples and offers simple guidelines which can be applied to improve project communication throughout your organization. This paper expands this topic, which was previously covered in KIDASA Software’s e-book “Successfully Presenting Your Projects”
Here are some simple guidelines:
EXAMPLE 1
Scenario: Customer Presentation
Strategy: Keep it Simple
A legend is used to explain that the aqua star is a milestone, the black bar is a Summary Task and the red bar is a normal task.
EXAMPLE 2
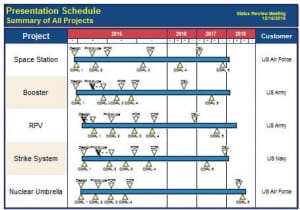
Scenario: Multiple project presented on one page
Strategy: Keep it Simple
 EXAMPLE 3
Scenario: Your management or your customer wants to see the current project status compared to the original plan.
Strategy: Keep it Simple
 EXAMPLE 4
This example illustrates many of the possible status variations in which you might find your tasks. Using simple symbology it is possible to illustrate a large number of schedule possibilities:
Symbology toolbox
Here is an example of symbology which might give you ideas for setting up your own standard symbology:
Also See:
Successfully Presenting Earned Value – Download