
Henry Gantt’s legacy to management
The Gantt chart began as a practical management tool, not as a software template. Its purpose was simple: show work against time so managers could compare what was promised with what was actually happening.
Henry Laurence Gantt (1861-1919) was an American mechanical engineer, management consultant, and industrial adviser. He developed several types of charts in the early twentieth century to help factories and government agencies plan work, measure progress, and see delays before they became invisible in tables of numbers.
The chart that now carries his name became widely known after World War I, especially through Wallace Clark’s 1922 book, The Gantt Chart: A Working Tool of Management. Clark described the key idea as showing planned work and completed work in the same space, both in relation to time. That is still the basic idea behind a modern Gantt chart.
There is one important historical nuance. Gantt was not the first person to use a time-based visual schedule. Polish engineer Karol Adamiecki developed an earlier method called the harmonogram, with related work dating to the 1890s. Adamiecki’s work was not widely adopted in the English-speaking management world, partly because it circulated in Polish and Russian rather than English. Gantt’s charts, and Clark’s later explanation of them, became the version that spread through American and Western industrial management.
Before Gantt: Adamiecki and the harmonogram
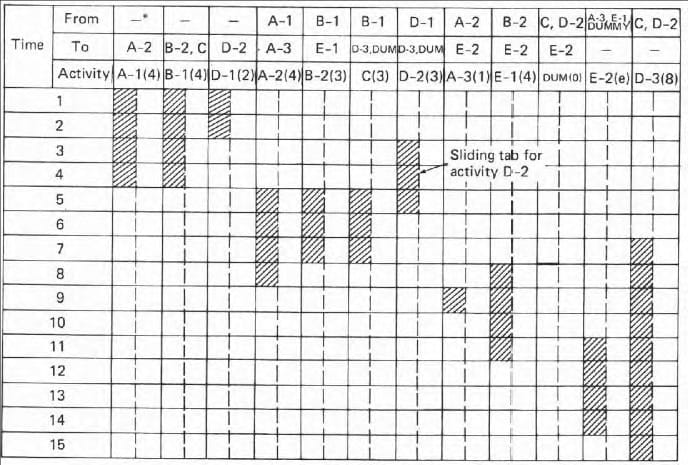
Karol Adamiecki (1866-1933), a Polish engineer and management researcher, created a scheduling method known as the harmonogram. It was designed to coordinate work and improve production flow. In modern terms, it was closer to a workflow scheduling system than a simple bar chart.
Adamiecki described the harmonogram publicly in 1903, and later accounts trace his workflow-network concept back to 1896. His method was important because it combined time, sequence, and coordination. It also anticipated ideas that would later appear in scheduling systems such as PERT and critical path methods.
So why is the chart called a Gantt chart rather than an Adamiecki chart? Recognition came down to timing, language, and distribution. Adamiecki’s work did not travel easily into English-language management literature. Gantt’s work did, especially after Clark published a clear English-language book explaining the charts and how managers used them.
What Gantt’s charts were actually for
Modern Gantt charts are usually used for project schedules: tasks on the left, time across the top, bars showing duration, and sometimes dependencies, baselines, milestones, or percent complete. Gantt’s early charts were related, but not identical.
Gantt’s charts were built for factories, machine shops, and wartime production. They helped managers see whether work was on schedule, ahead of schedule, or behind schedule. The charts were not just calendars. They were control tools. They showed promises, performance, quantities, idle time, and responsibility.
In 1917, General William Crozier, then Chief of Ordnance, brought Gantt in as a consultant after seeing factories where Gantt had installed his methods. During World War I, the U.S. government needed to track rapidly expanding orders for arms, munitions, ships, and aircraft. Ordinary tables were too bulky and too slow to interpret. Gantt’s charts helped officials compare scheduled production with actual progress.
Clark later wrote that in 1918 the charts were used in U.S. arsenals, naval aircraft production, Emergency Fleet work, Shipping Board work, and other government production efforts. That wartime use is one of the strongest documented early examples of Gantt charts being used at scale.
Henry Gantt: a brief biography
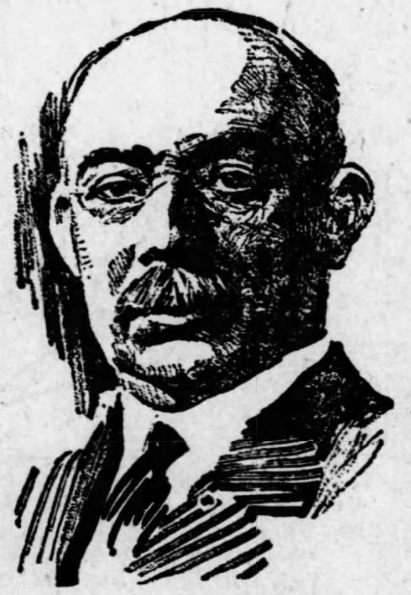
Henry Laurence Gantt was born on May 20, 1861, in Calvert County, Maryland. He came from a slaveholding plantation family. The Civil War began a month before his birth, and after the war the family’s circumstances changed sharply. Gantt’s later career unfolded far from the plantation world he was born into, in the industrial shops, factories, and engineering offices of the late nineteenth and early twentieth centuries.
Gantt entered McDonogh School in November 1873 and graduated at the top of his class in 1878. He then attended Johns Hopkins University, earning an A.B. in 1880. After returning to teach at McDonogh for several years, he went on to Stevens Institute of Technology, where he completed a degree in mechanical engineering in 1884.
Early in his career, Gantt worked in industrial plants and machine shops. In 1884, he began work at Poole & Hunt, a Baltimore iron foundry and machine shop. In 1887, he began working with Frederick Winslow Taylor, one of the central figures in scientific management. Gantt worked with Taylor at Midvale Steel and Bethlehem Steel before developing his own consulting career.
Gantt’s work was not limited to charts. He wrote about industrial efficiency, wages, management responsibility, labor cooperation, and what he called the task and bonus system. He believed management had an obligation to study work carefully, set fair standards, remove obstacles, and reward performance. Whether one agrees with scientific management or not, Gantt was trying to make industrial work measurable and visible.
Gantt married Mary Eliza Snow of Fitchburg, Massachusetts, in 1899. They had one daughter, Margaret Heighe Gantt, who later became a physician. Gantt spent much of his adult life in Montclair, New Jersey, and died there on November 23, 1919.
The chart becomes a management tool
The name “Gantt chart” became strongly associated with Wallace Clark’s book, The Gantt Chart: A Working Tool of Management. Clark had worked with Gantt and helped preserve and explain his methods after Gantt’s death.
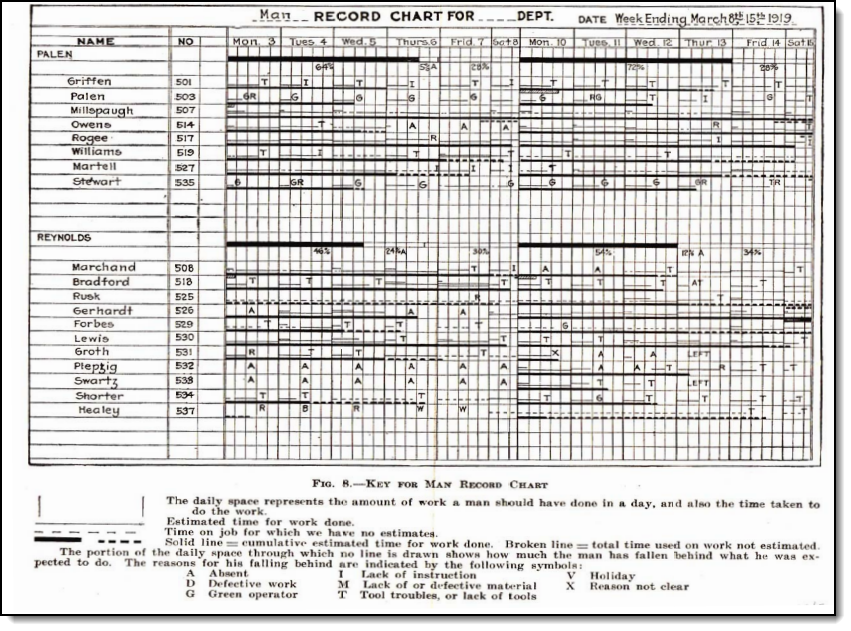
Clark’s book emphasized that the chart was not just a record of the past. It was a way to manage the present and anticipate the future. If work was falling behind, the chart made that visible. If equipment was idle, the chart helped show why. If a promise could not be kept, the manager had a better chance of seeing the problem before the deadline arrived.
Clark also noted that Gantt did not try to patent or copyright his charts. He shared samples, published examples, and allowed other people to use and adapt the method. That openness helped the chart spread.
Over time, Gantt-style charts moved beyond factory production. They became common in construction, engineering, government work, and eventually software-based project management. Large infrastructure projects such as Hoover Dam and the U.S. Interstate Highway System are often cited in project-management histories as examples of large-scale scheduling practice, but the stronger documented early record is Gantt’s wartime production work during World War I.

How Gantt charts changed over time
Early Gantt charts were drawn by hand. A change in schedule often meant redrawing part of the chart. Managers sometimes used paper strips, marks, pins, or other physical adjustments to keep charts current.
By the late twentieth century, personal computers made Gantt charts easier to create and update. Software added features that were not part of Gantt’s original charts: dependencies, critical paths, baselines, resource assignments, percent-complete shading, and automatic date recalculation.
The modern Gantt chart is therefore both old and new. The visual idea is old: work laid against time. The software behavior is new: automatic dependency logic, schedule recalculation, reporting, filtering, and export. Gantt would recognize the basic timeline, but he would not have seen his early charts as simple decoration. They were management instruments.


The Gantt Medal
The Henry Laurence Gantt Medal was established in 1929. It recognizes distinguished achievement in management and service to the community. That combination fits Gantt’s reputation: he was interested not only in mechanical efficiency, but also in the responsibilities of management and the relationship between industrial work and society.
Original books and sources
If you want to read the original source material, these are the best starting points:
- The Gantt Chart: A Working Tool of Management, Wallace Clark, 1922. This is the most useful primary source for understanding the early Gantt chart and how it was used in management.
- Work, Wages, and Profits, Henry L. Gantt, revised edition, 1919. This covers Gantt’s broader thinking on wages, task setting, efficiency, and management responsibility.
- Work, Wages, and Profits: Their Influence on the Cost of Living, Henry L. Gantt, 1910. This earlier scan is useful if you want to compare editions.
- Industrial Leadership, Henry L. Gantt, 1916. A shorter book on leadership, training, task work, and production.
- Organizing for Work, Henry L. Gantt, 1919. One of Gantt’s later works and an important source for understanding his thinking near the end of his career.
- The Harmonogram: An Overlooked Method of Scheduling Work, Edward R. Marsh, Project Management Quarterly, 1976. A useful source on Karol Adamiecki and the harmonogram.
- The Henry (Harry) L. Gantt Collection, McDonogh School Archives. A concise archival biography with details on Gantt’s education and career.
The early Gantt and Clark books listed above were published before 1930 and are available through public digital libraries.
Why the Gantt chart still matters
The Gantt chart has survived because it solves a basic communication problem. A schedule in a table can be accurate and still be hard to understand. A Gantt chart makes time visible.
That visibility is still useful. A manager can see overlapping work, long tasks, idle gaps, missed dates, and crowded periods at a glance. A client can understand the plan without learning a scheduling system. A team can see whether the work is still aligned with the promise.
Modern project software has added many layers to the original idea, but the core remains close to Gantt’s purpose: show the work, show the time, and make progress or delay visible enough that people can act.
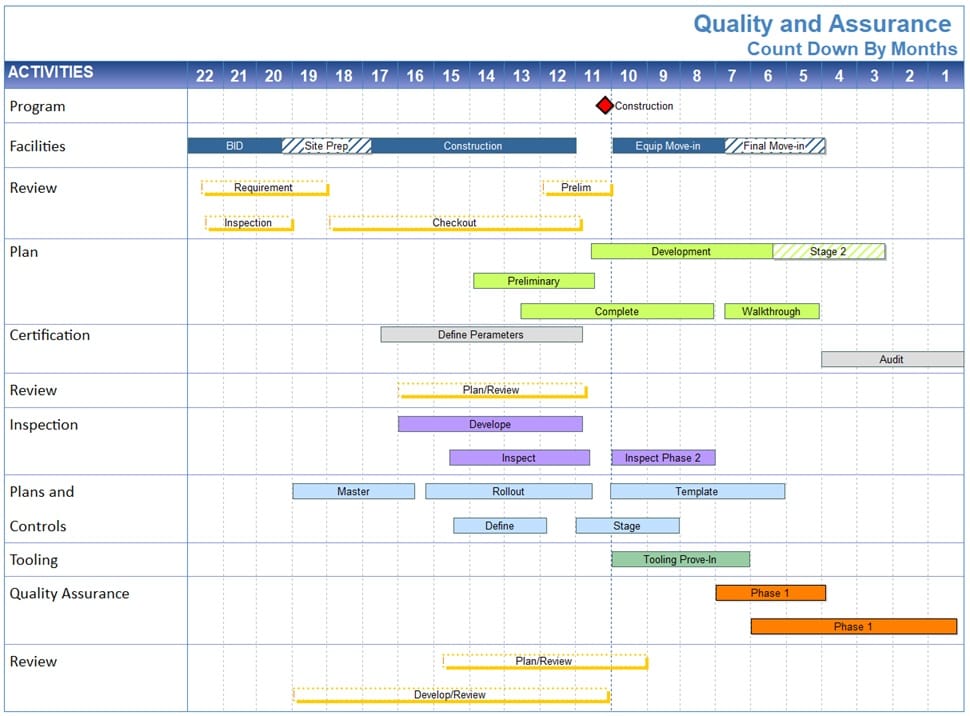
For practical guidance on building modern Gantt charts, see the Gantt Chart Formatting & Design guides.