
GanttChart.com publishes practical guides for building, formatting, exporting, troubleshooting, and presenting Gantt charts. The tutorials cover Excel, PowerPoint, Microsoft Project, Google Sheets, and other scheduling or timeline tools.
Start with the basics if you’re new to Gantt charts, or browse by task if you’re solving a specific problem, such as formatting a chart, exporting it for executives, building swimlanes, or choosing the right tool.
Browse by Topic
The site is organized by the kind of problem you’re solving.
Formatting & Design
Make your Gantt chart easier to read: colors, labels, layout, swimlanes, and visual cleanup.Exporting & Sharing
Get your Gantt chart out of the software and into PDFs, PowerPoint, Excel, and executive review documents.Choosing the Right Gantt Chart Tool
Not every Gantt chart belongs in the same tool. Excel and Google Sheets work well for simple schedules you can update by hand. PowerPoint is useful when the chart is mainly a presentation slide. Microsoft Project makes more sense when the schedule has dependencies, constraints, and regular changes.
For polished timelines and executive reporting, tools like Milestones Professional or Office Timeline can save formatting time. For team-managed schedules, TeamGantt and Smartsheet are usually a better fit.
Latest Articles
-
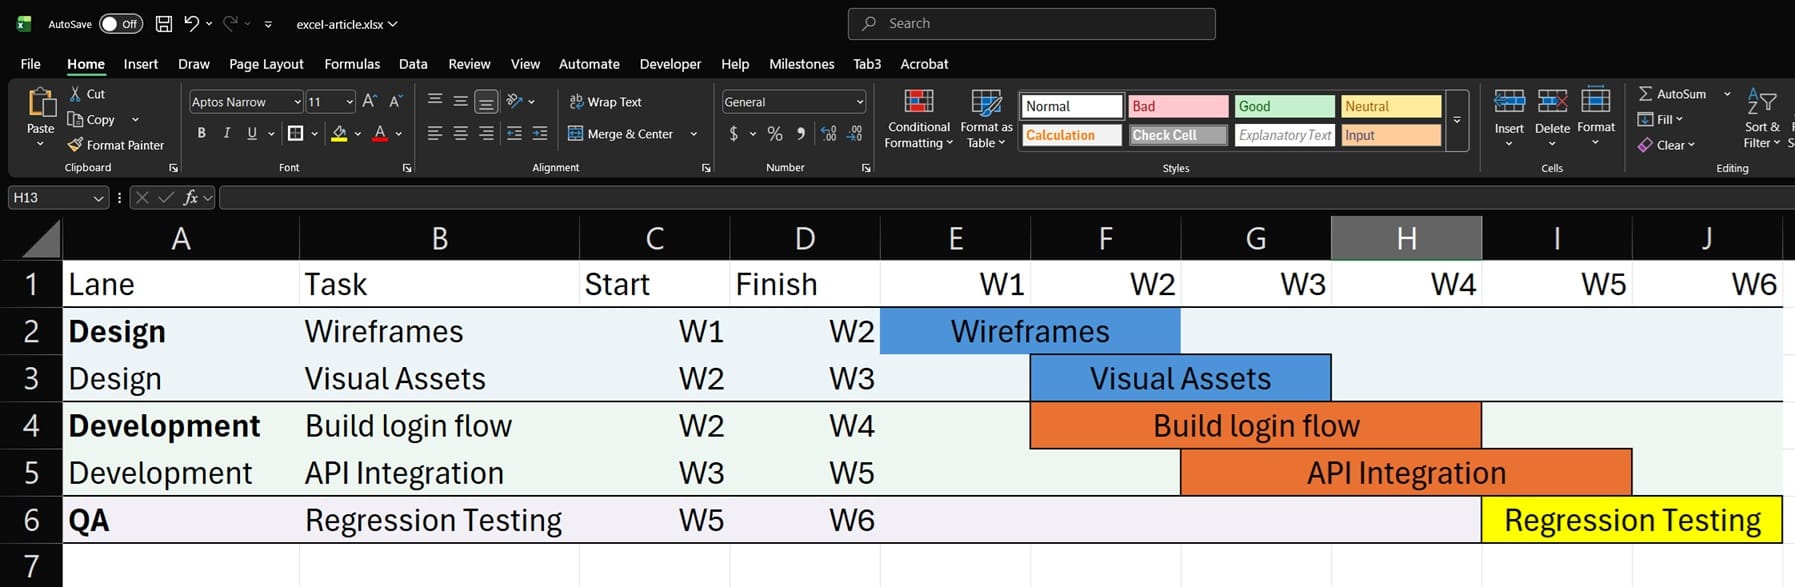
How to Make Swimlanes in Excel: A Step-by-Step Guide
Excel has no native swimlane feature. This guide shows how to build one with row bands, fill colors, merged labels, task bars, and conditional formatting.
-
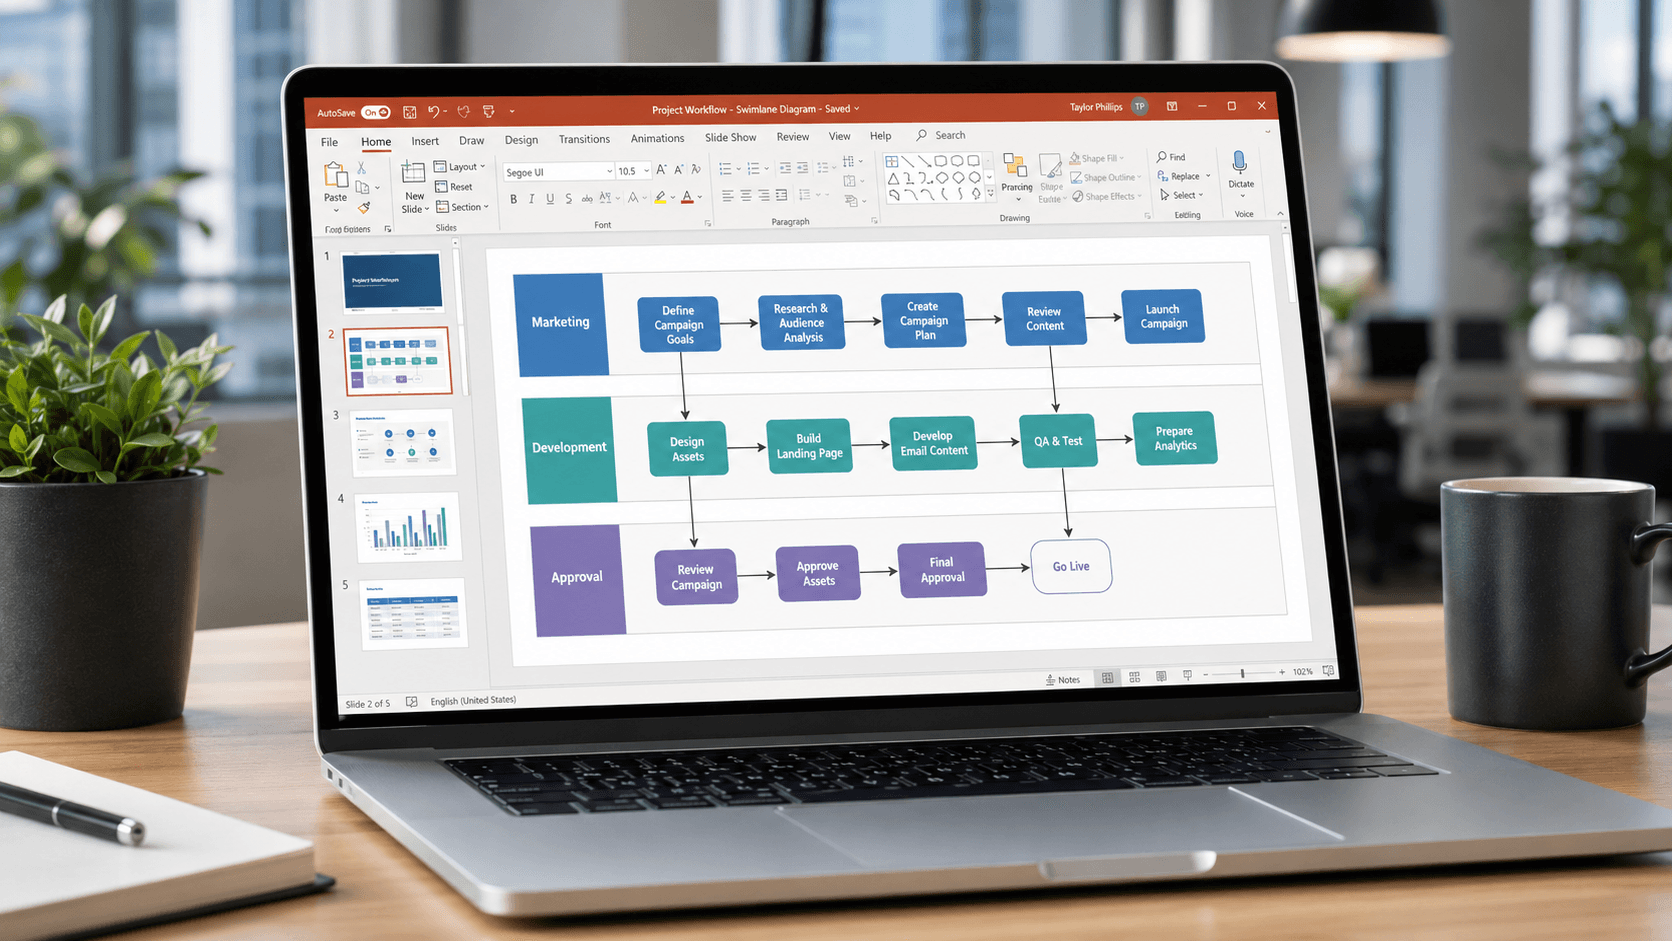
How to Make a Swimlane Diagram in PowerPoint (3 Methods That Actually Work)
Three ranked methods for building a swimlane diagram in PowerPoint: No add-ins, no plugins, and honest guidance on when to switch tools.
-
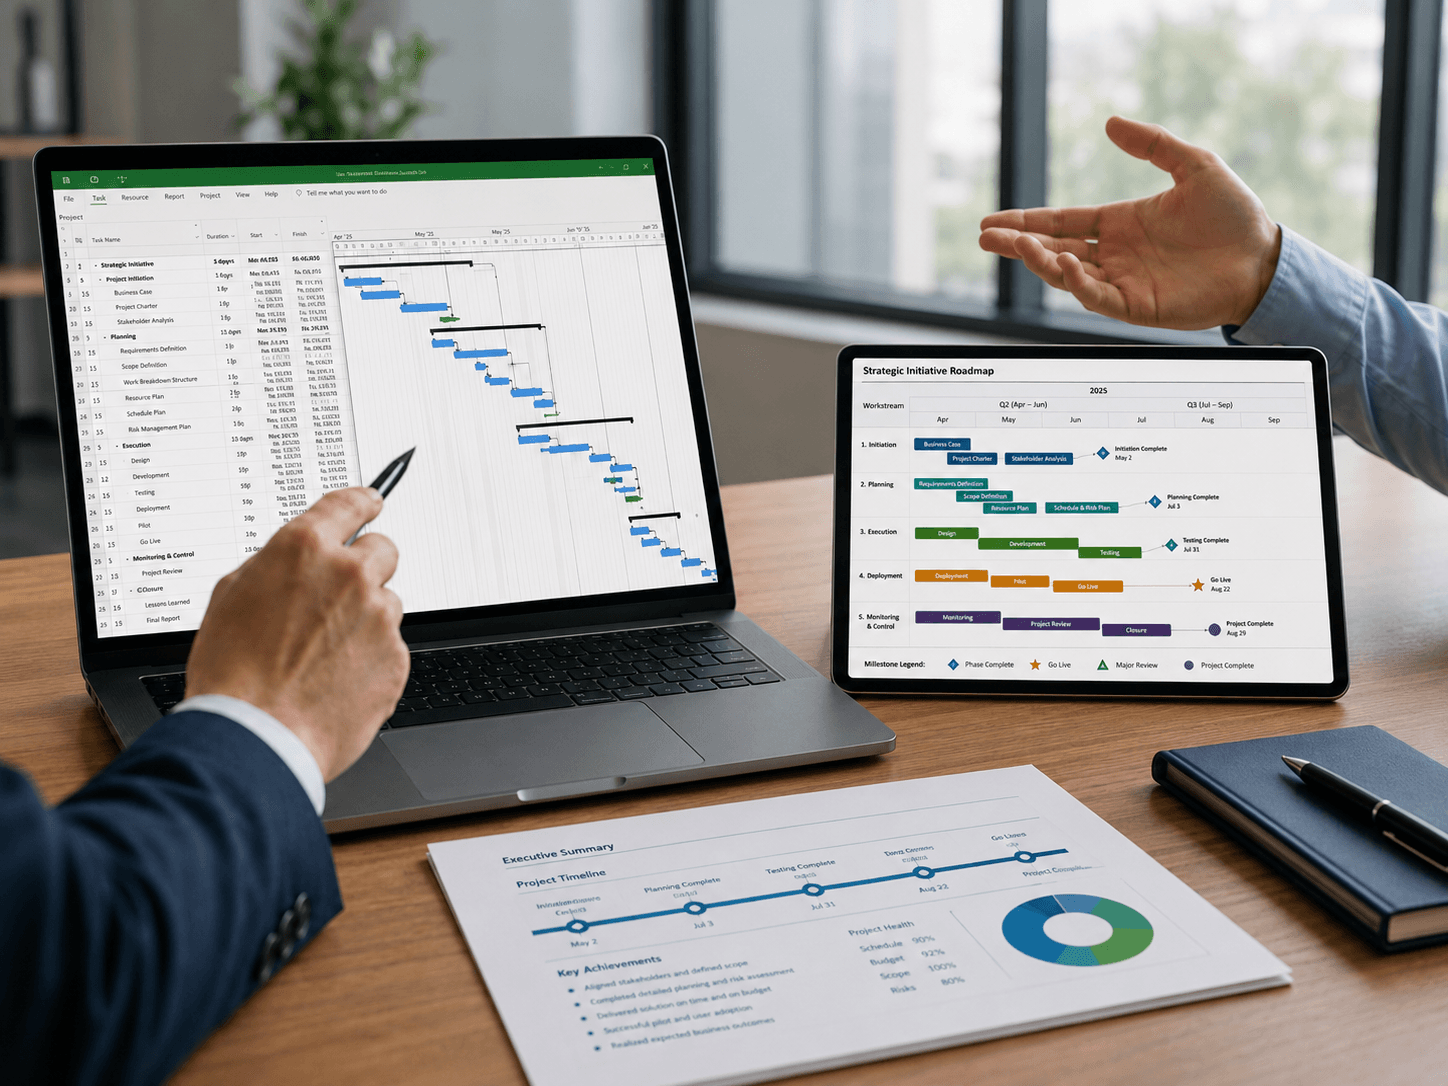
How to Export a Microsoft Project Gantt Chart for Executive Review (Without the Clutter)
Three ways to get a Gantt chart from Microsoft Project into an executive review without it looking like a data dump — with a quick comparison and a pre-send checklist.