Milestones Professional – Premier Gantt Chart Software
Get Started Now Creating Great Gantt Charts
Build Gantt charts using a huge assortment of presentation-ready bars and symbols
Most Gantt chart software offers an assortment of display options, but Milestones Professional’s huge built-in assortment of symbols and bars is second to none. The built-in toolbox can hold up to 64 symbols and 32 bars at one time! These are the building blocks of the Gantt chart. No other Gantt chart software offers this much customization.
500 events on each row of the Gantt chart!
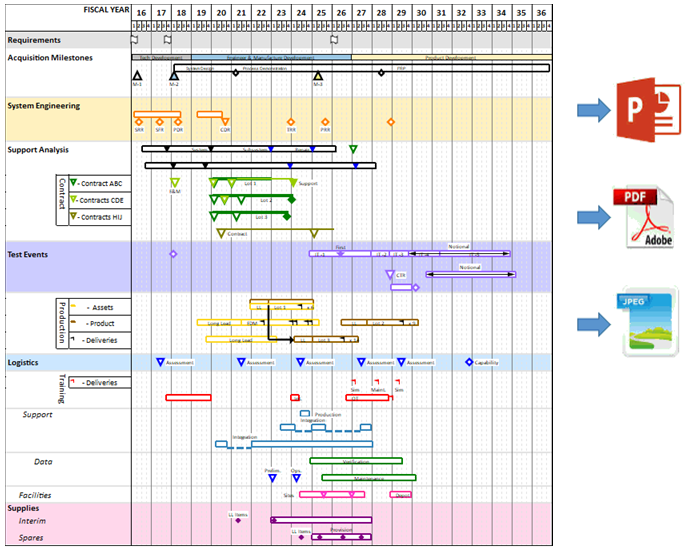
As many as 500 individual project milestones can be added to any task row on the schedule. They can be stand-alone project milestones or can represent project start and end dates. Create a “Birds on a Wire” chart like this one…..
Expand date ranges on the Gantt chart to show key dates
With “logarithmic” date headings it’s easy to show all of the project’s dates on a project schedule, including those far in the future. Choose to expand the dates on the Gantt chart which require immediate attention.
Fill bars and symbols on the Gantt chart to show activity progress
Choose a color for the progress up to the status date, and a different color after the status date. Individual tasks and individual bars on the same task can be adjusted to reflect whether they are on schedule, behind schedule, or ahead of schedule.
Percent Complete SmartColumns
Percent Complete SmartColumns display the percentage with an optional percent complete pie, or just the percent complete pie symbol, as measured by the status symbol (here, the arrow symbol).
Create Crystal-Clear, Single-Page Presentation Reports
There are times when you want to make a presentation that’s short, to the point, and conveys crucial information quickly. That’s when Milestones Professional comes in handy. Milestones makes it easy to communicate a lot of vital project information all on a single page. Create integrated master schedules, swim lane reports, “birds on a wire” reports, and much more!
Create persuasive presentation reports for Microsoft Project!
When you put the power of Milestones to work, you’ll transform Microsoft Project, Microsoft Project Server, or even Primavera schedules into attractive, persuasive, executive-level presentation reports that get noticed. When your Microsoft Project or P6 schedules change (which they often do!), you can choose to “refresh” the presentation schedule with the latest dates.
Create a variety of reports from Microsoft Project files
Using the Project to Milestones “wizard” create a wide variety of presentation reports
Build a schedule “free-form” and link it to one or more Microsoft Project schedules
Using the Project to Milestones “wizard” create a wide variety of presentation reports
Finally, get “at a glance” reporting
With Milestones Professional, it’s easy to instantly get the “big picture” and see how your project is progressing. Easily add stoplight indicators, percent-complete pie charts, and status symbols to any project schedule. Using these, you’ll see “at a glance” the exact status of your project. At last you’ll be where you’ve always wanted to be. In complete control of your project!
DataGraphs and ValueSets
In addition to having powerful scheduling and tracking capabilities, Milestones Professional can also display graphs relating to the schedule.
Calculation/Indicator SmartColumns
Perform mathematical (+, -, X, /) on values which are entered into columns for tasks on the schedule. Optionally display an indicator (like a stoplight or a % complete pie) for easy insight into key project metrics.
Stoplight SmartColumns
Stoplight (Red-Green-Yellow usually) are used on the Gantt chart to display a wide variety of indicator symbols. Stoplight SmartColumns offer a quick and easy method for adding stoplights to the Gantt chart, with no setup needed.
Organize Gantt charts with outlines
Milestones Professional offers an easy-to-use outlining capability. Organize projects on the Gantt chart into tasks and sub-tasks and use outline level shading to highlight levels. A click of the mouse is all that’s needed to “roll-up” lower level tasks on the Gantt chart into a summary bar.
Share Your Reports with a Single Click
Copy your multi-page Gantt chart to PowerPoint with a single click. Create a multi-page PDF of your Gantt chart and e-mail to your team. There are many ways
Click here to add your own text


